WARNING: For the animals' safety, privacy, and rights, I will not show pictures of any animals during an experiment. However, that said, this page may/will contain sensitive material pertaining to the use of animals in a lab setting. If you are at all uncomfortable with this, I would look no further on this page.
Thank you!
Thank you!
Thursday, June 13th 2013
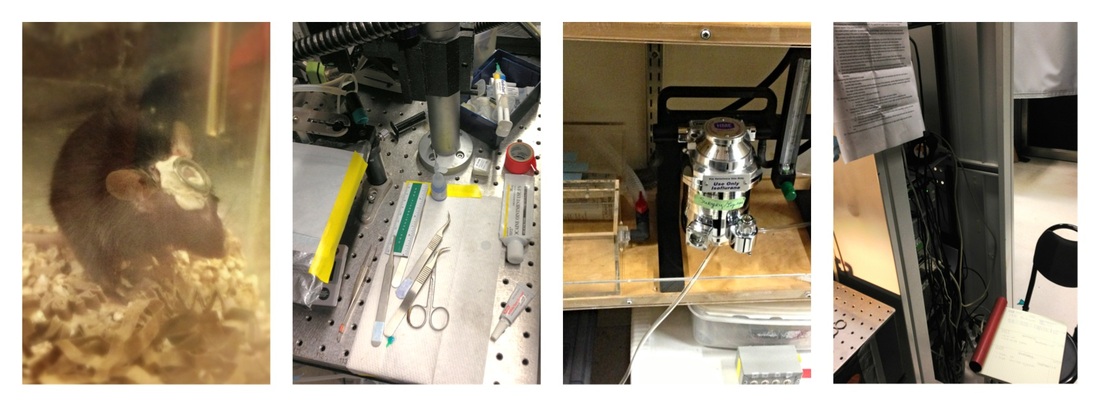
Head-framing - (1) a completely healthy & awake, head-framed mouse (2) the tools for the stereotax and head-frame setup
(3) the isoflurane anesthesia setup for the anesthesia chamber (shown), stereotax, and head-frame setups (4) my improvised lab notebook and head-framing protocol setup
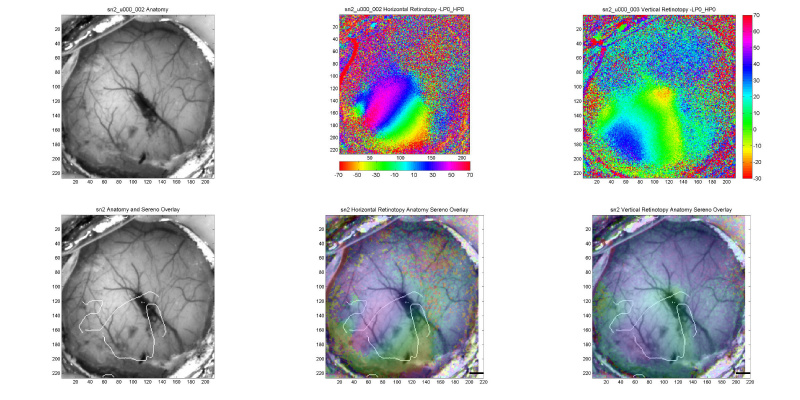
Brain Maps - Here are some of the data samples taken from the Intrinsic Imaging experiment on the second mouse I've ever head-framed and experimented on. The two black and white ones on the far left show the blood vessels in the mouse's skull and brain. The two in the middle show data for the mouse brain's response to visual stimuli running horizontally/azimuth-wise on the screen. The two to the left show data for the mouse brain's response to visual stimuli running vertically/altitude-wise on the screen. The white curvy lines on the three pictures on the bottom represent the computer's estimated analyzation of where it thinks each area of the visual cortex is, based off of the brain activity data it received. However with this one, you can tell where the visual cortex is by just looking at the color maps, because right where the visual cortex is, you can see an almost complete rainbow pattern (which is good, because each color of the rainbow represents a point in the mouse's visual space. For example, red represents what was seen by the mouse more towards its nose, and purple represents what was seen more towards its temporal area/ear.)
Friday, May 31st 2013
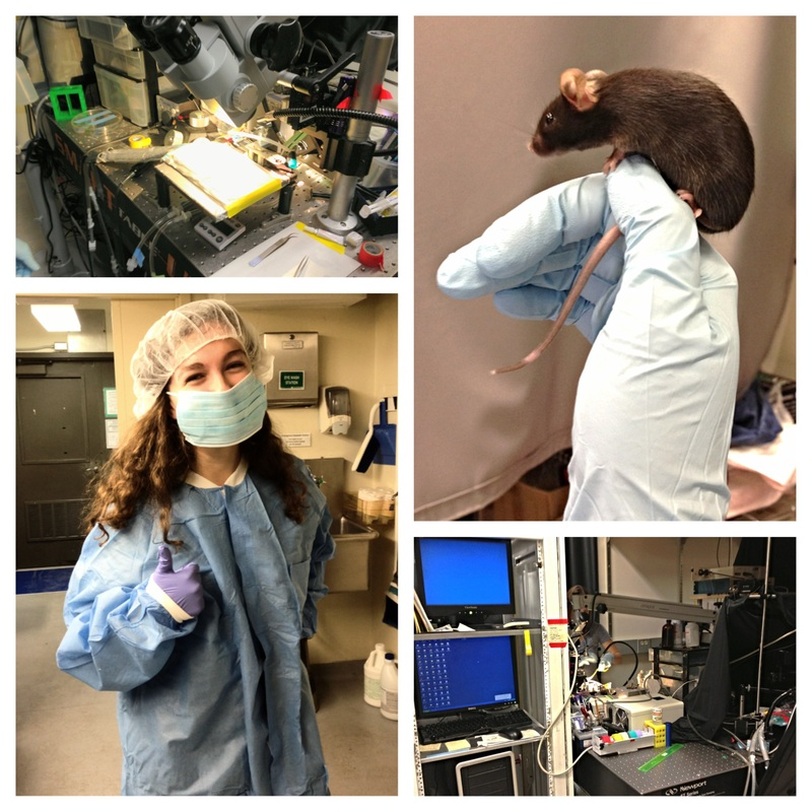
First Week in the Lab - Getting adjusted to my environment and learning how to perform surgeries and run visual stimulus experiments on mice!
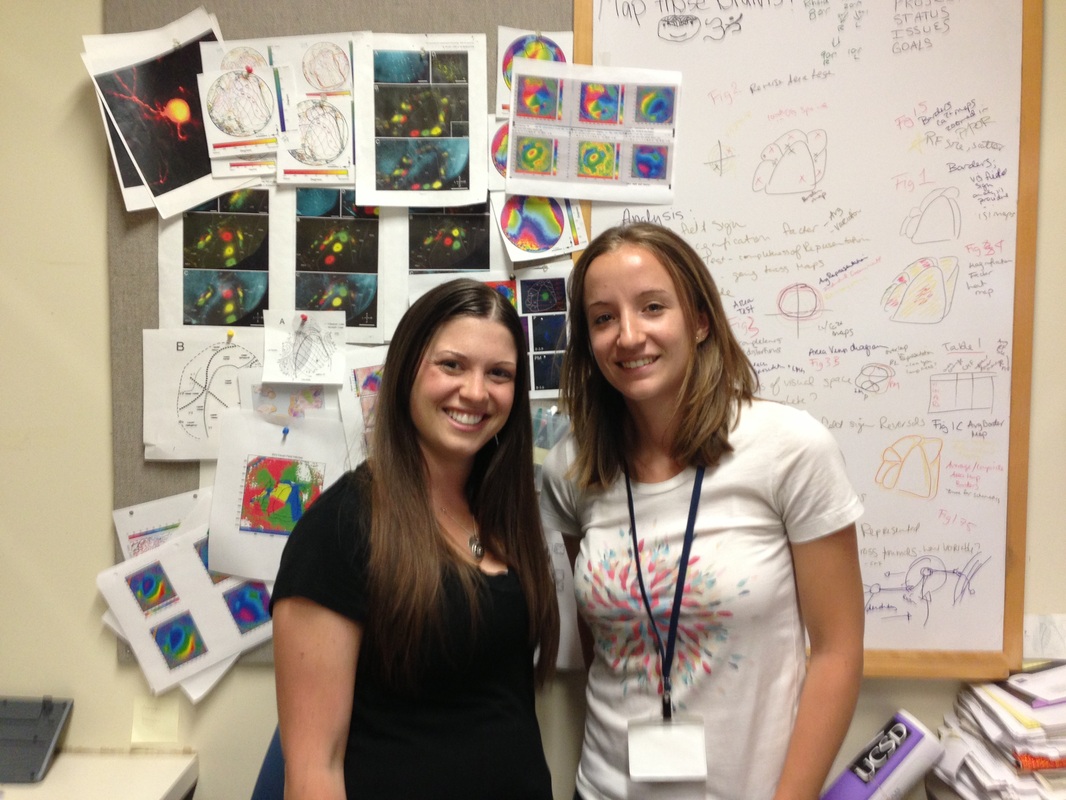
My Mentor(s) - Ashley (right) is primarily my internship mentor, but Marina (left) has also taught me a ton and I've observed her run a few different experiments on mice as well.
